What Eco does.
Five things, done for every site and every device you own.
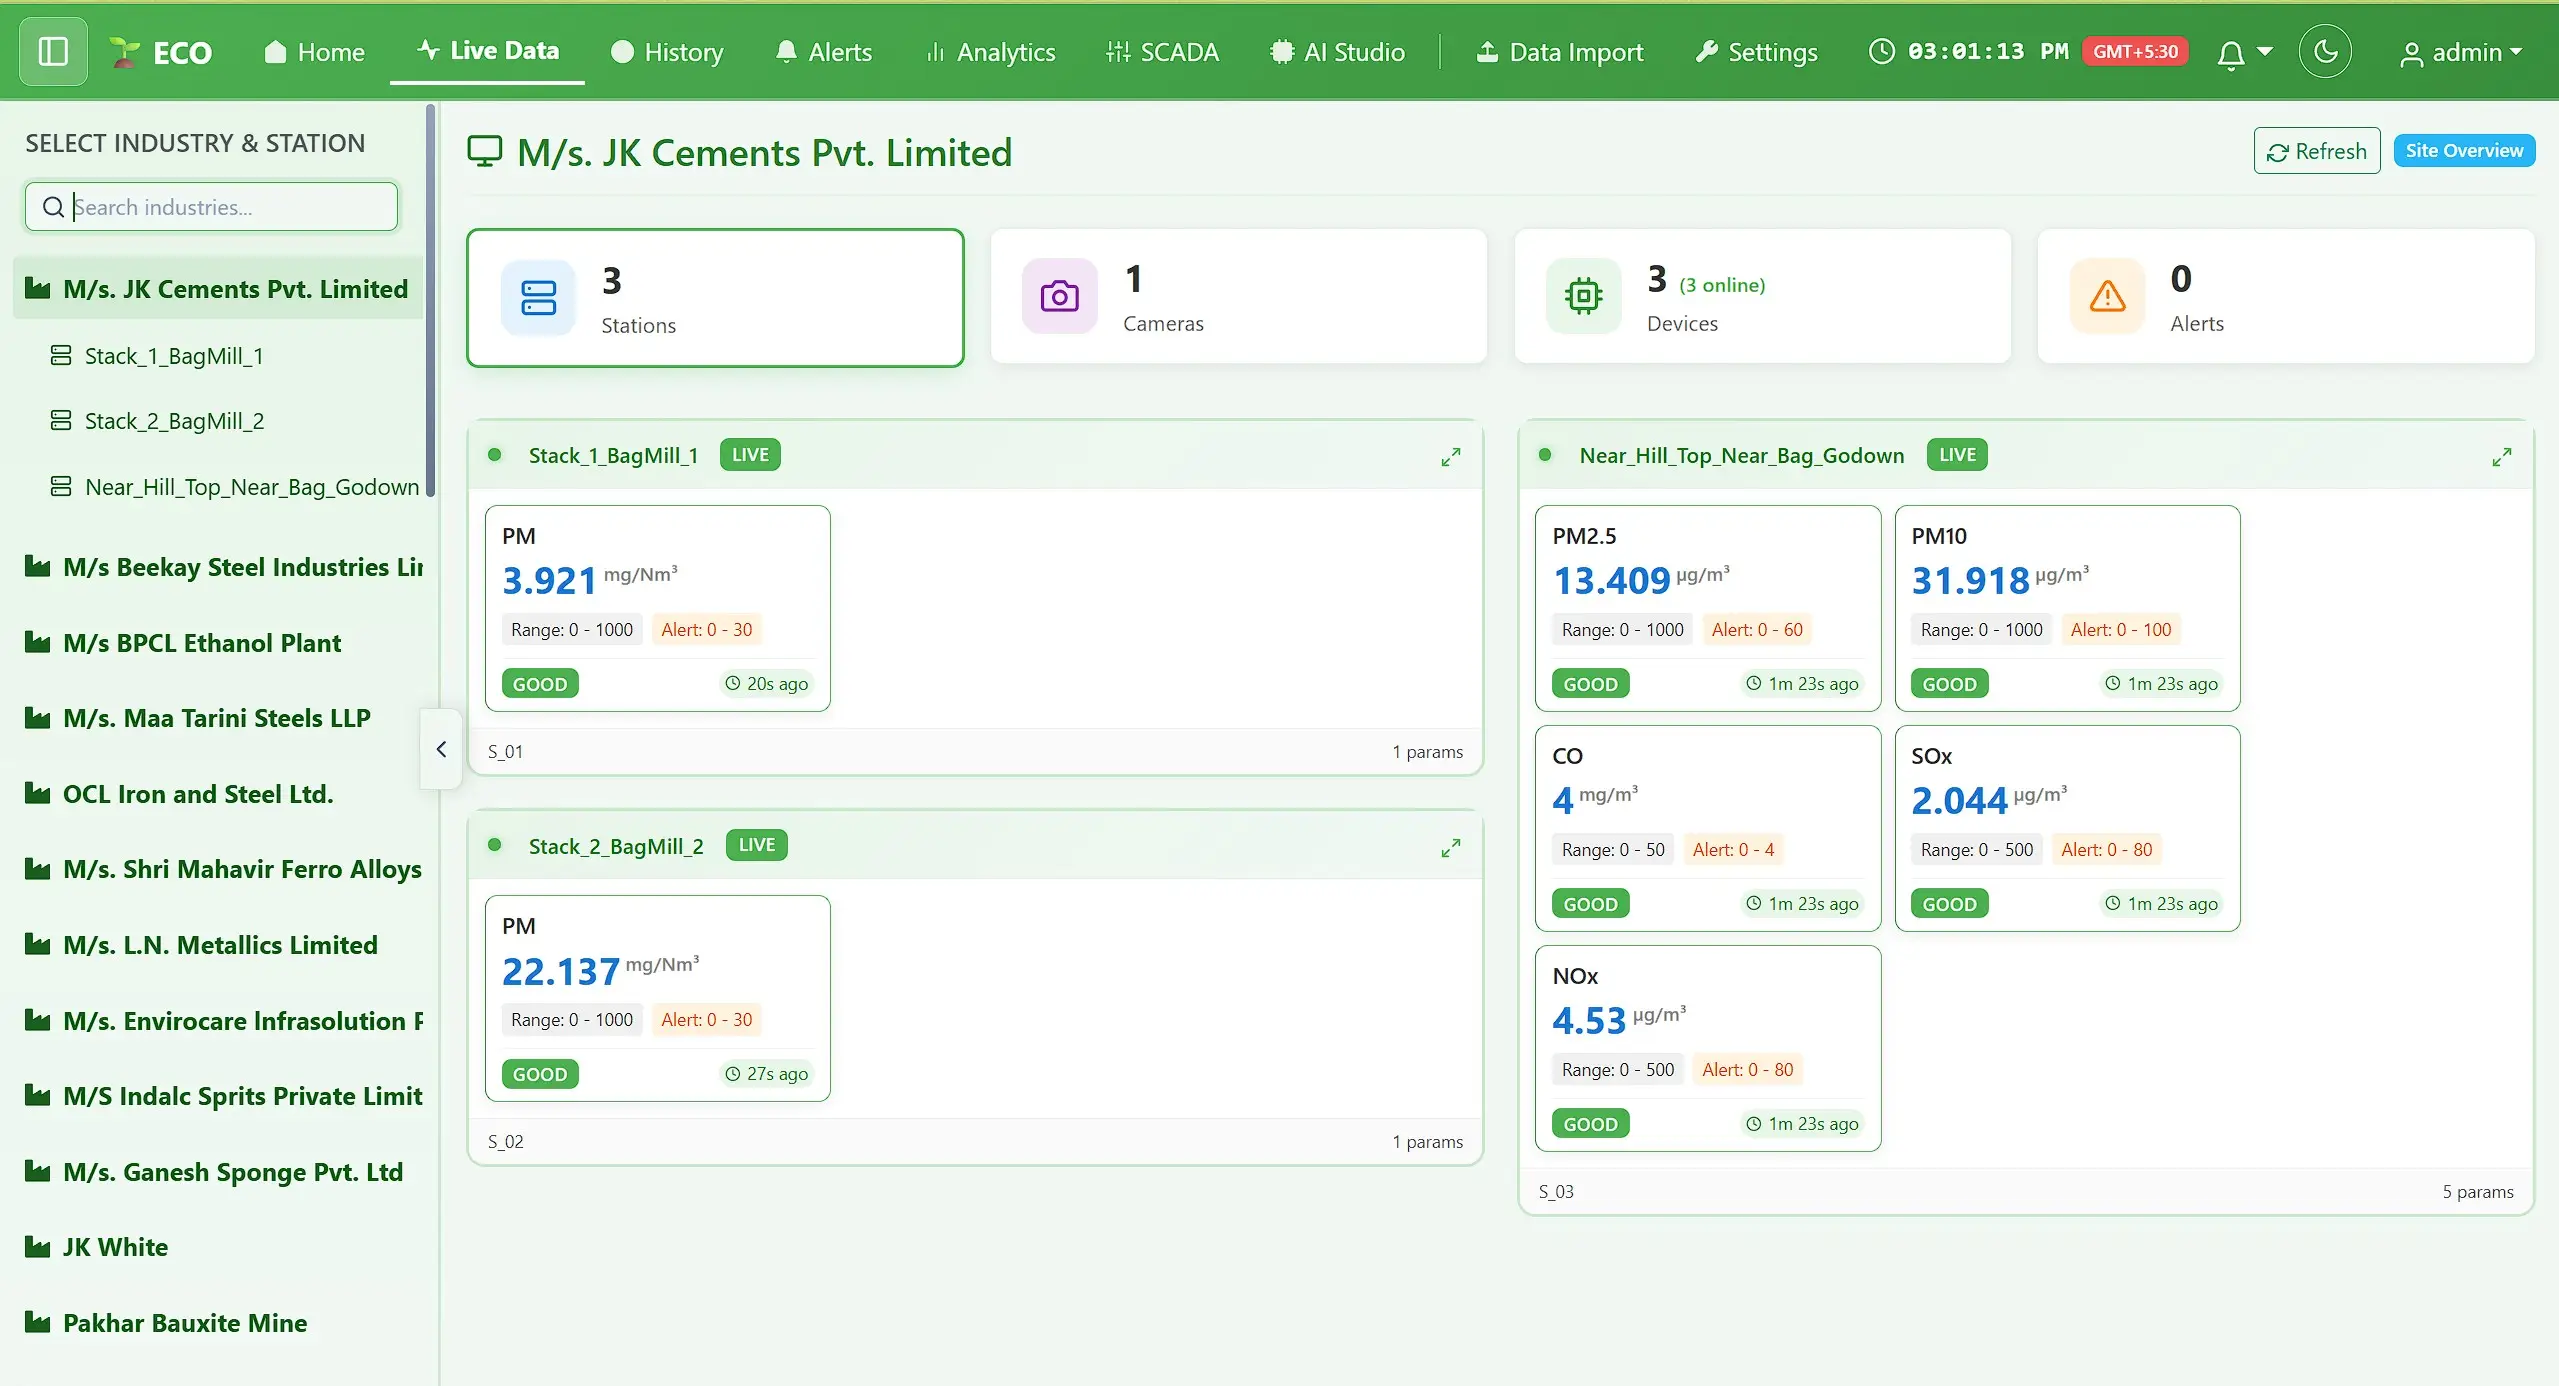
Live IIoT data
Readings from every registered logger, streaming in as they are taken. Tags, units and scaling are set once and applied everywhere.
Prediction analytics
Forecast where a series is heading and see a breach before it happens, not in the report afterwards.
Alerts
Thresholds per tag, escalation paths and acknowledgement, delivered where your team already looks.
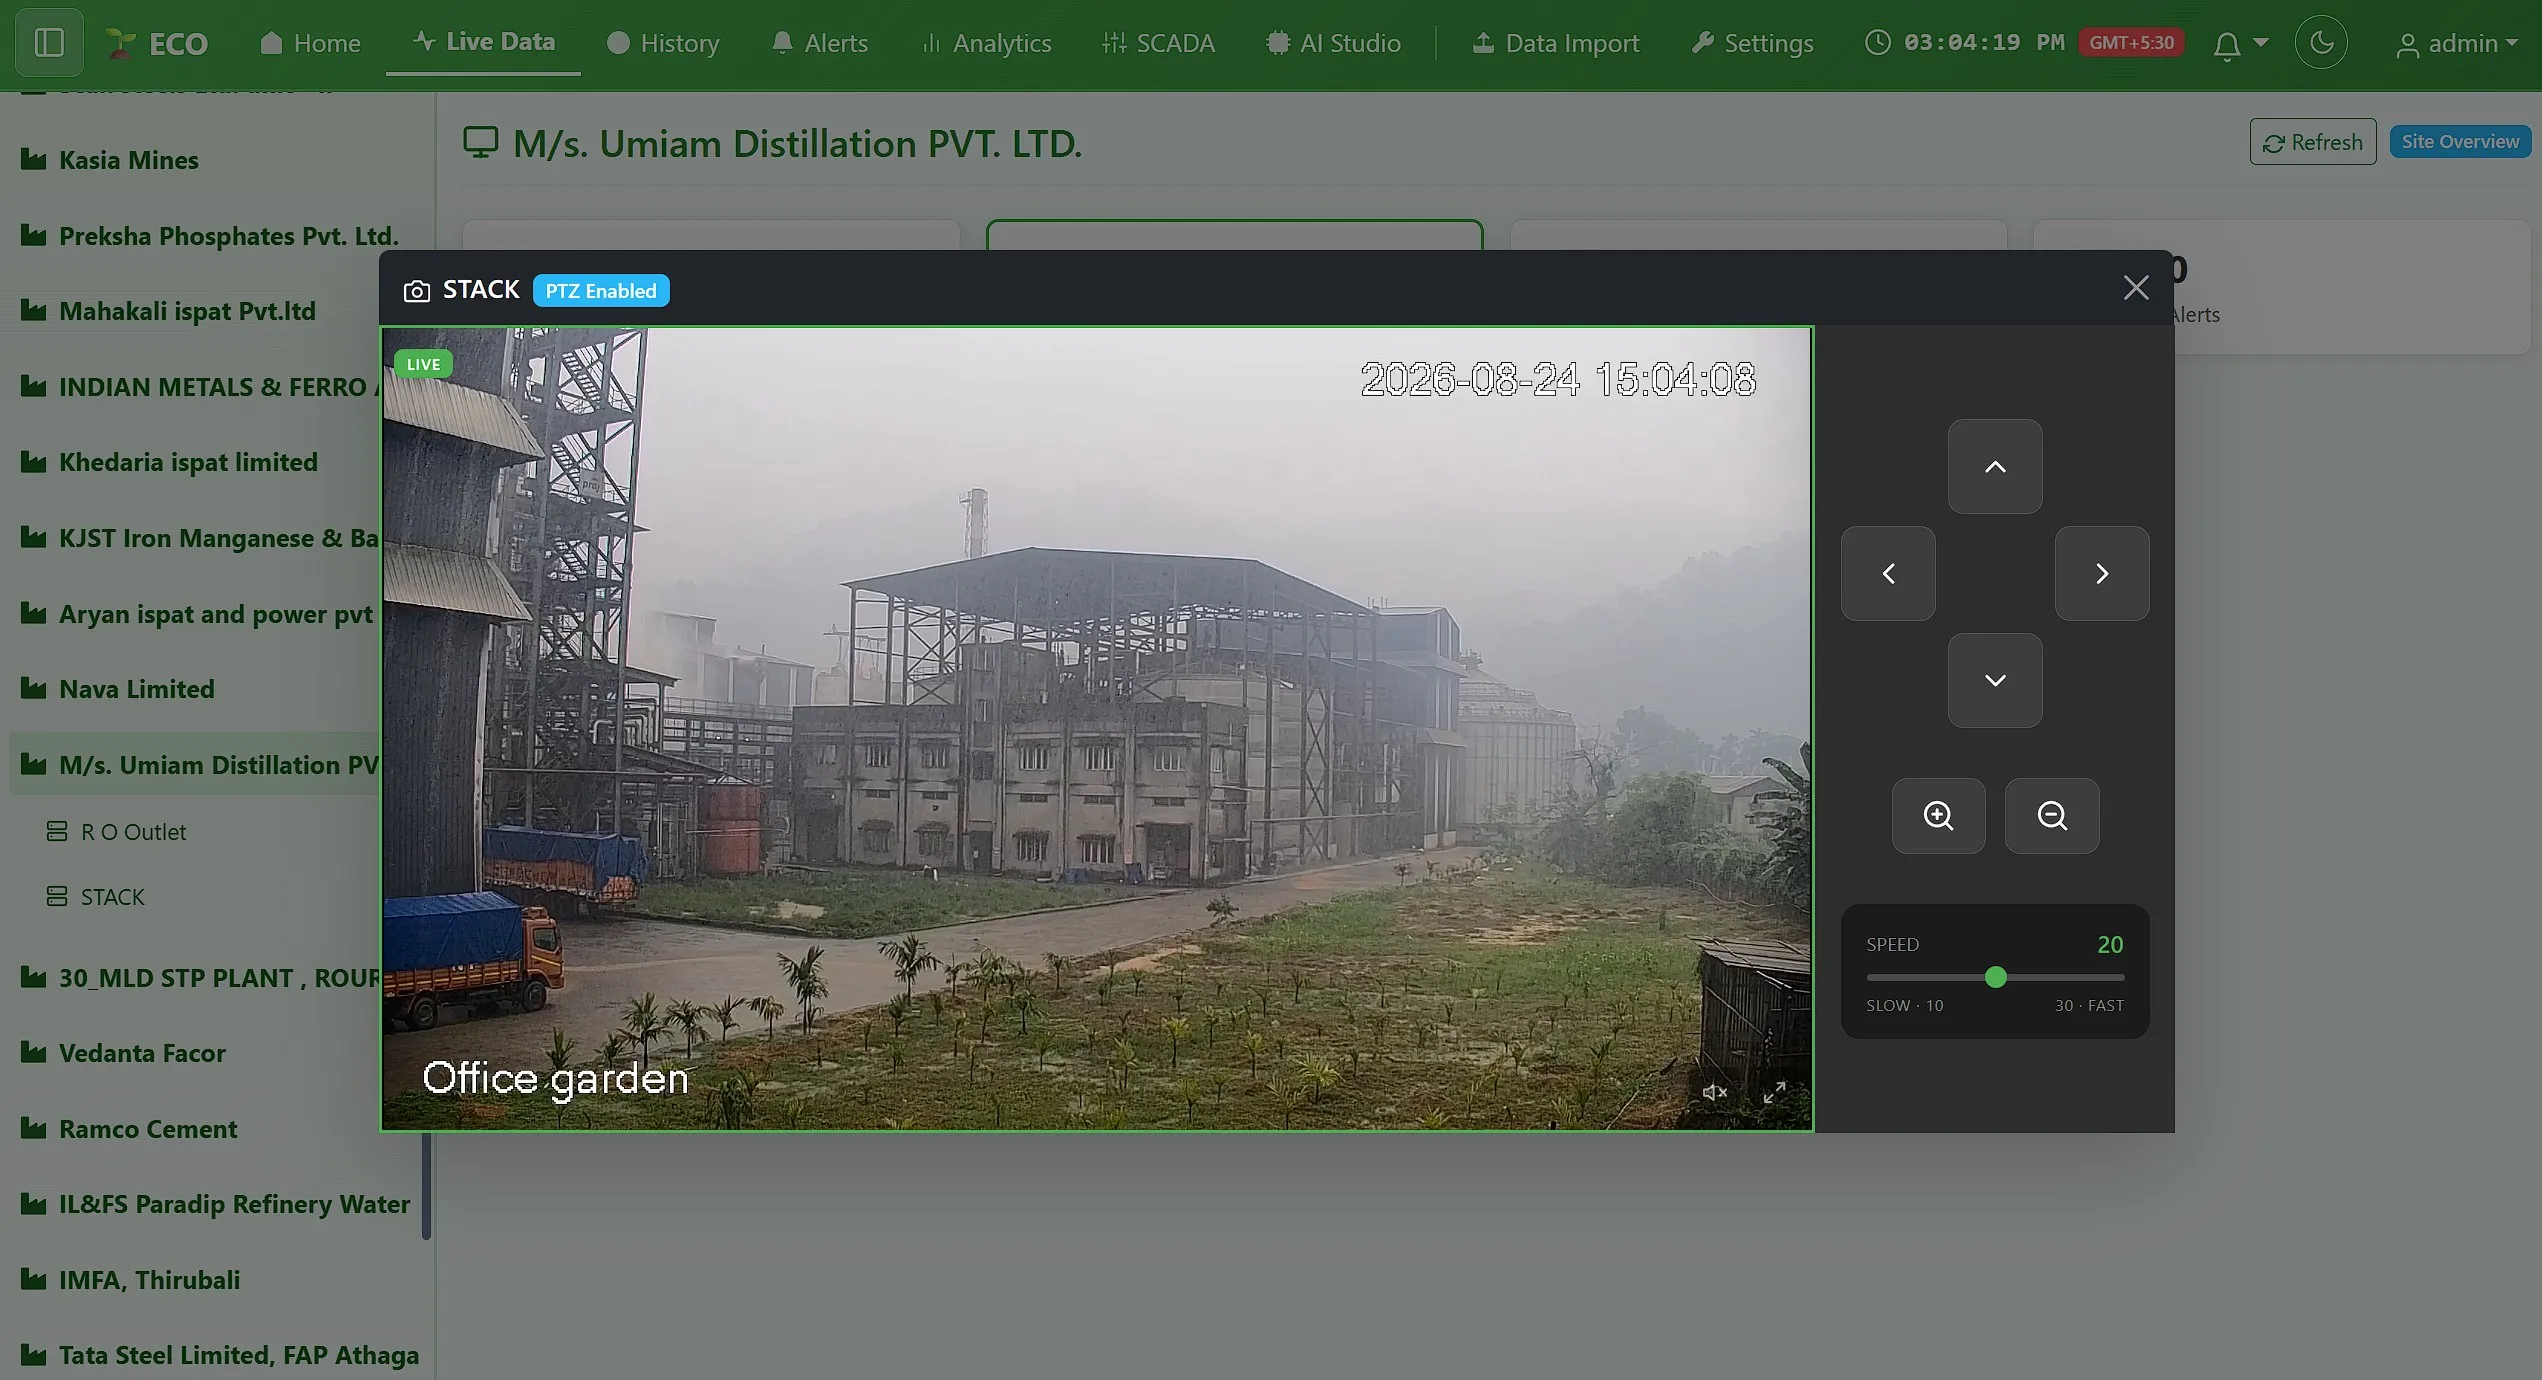
Live camera feeds
Remote viewing of the stack, the floor or the panel room, alongside the numbers it produces.
Dozens of widgets
Gauges, trends, tables, maps, totals. Build the dashboard each role needs and share it.
Arrange it once, for each team.
The plant manager wants totals and trends. The EHS officer wants limits and upload status. Same data, two dashboards, no second system.
A breach is a message, not a discovery.
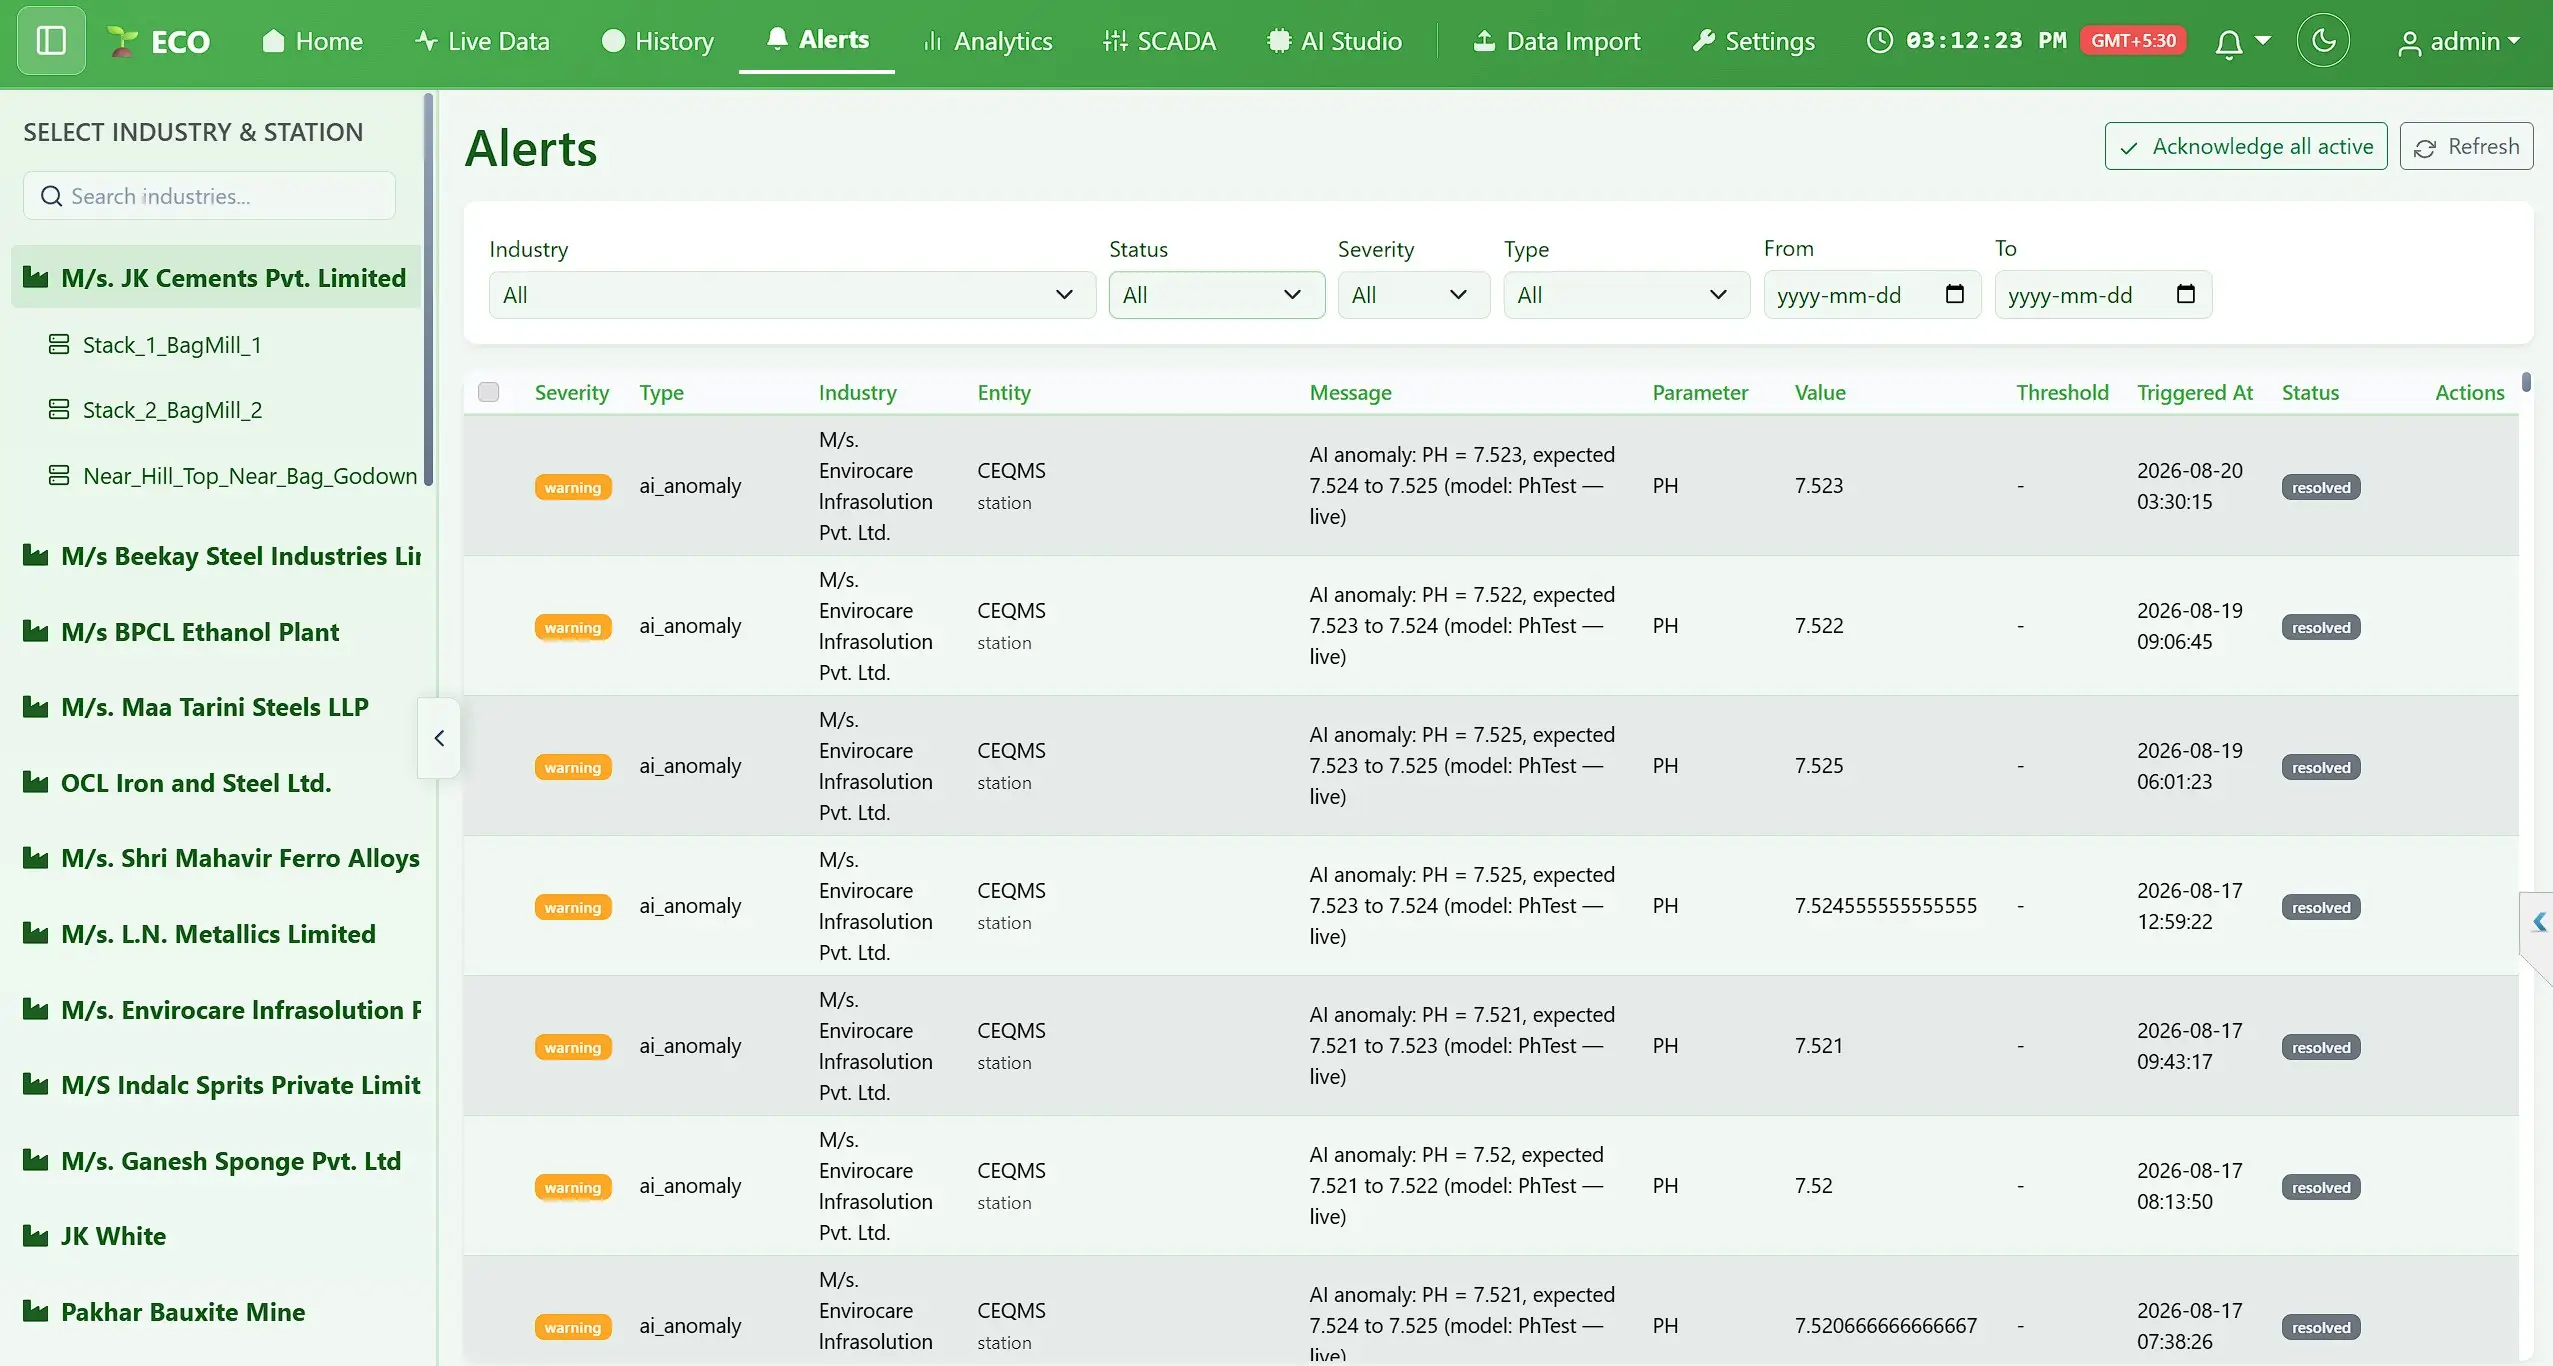
Set the limit on the tag, choose who hears about it and how, and let Eco chase the acknowledgement.
See the asset, not just its reading.
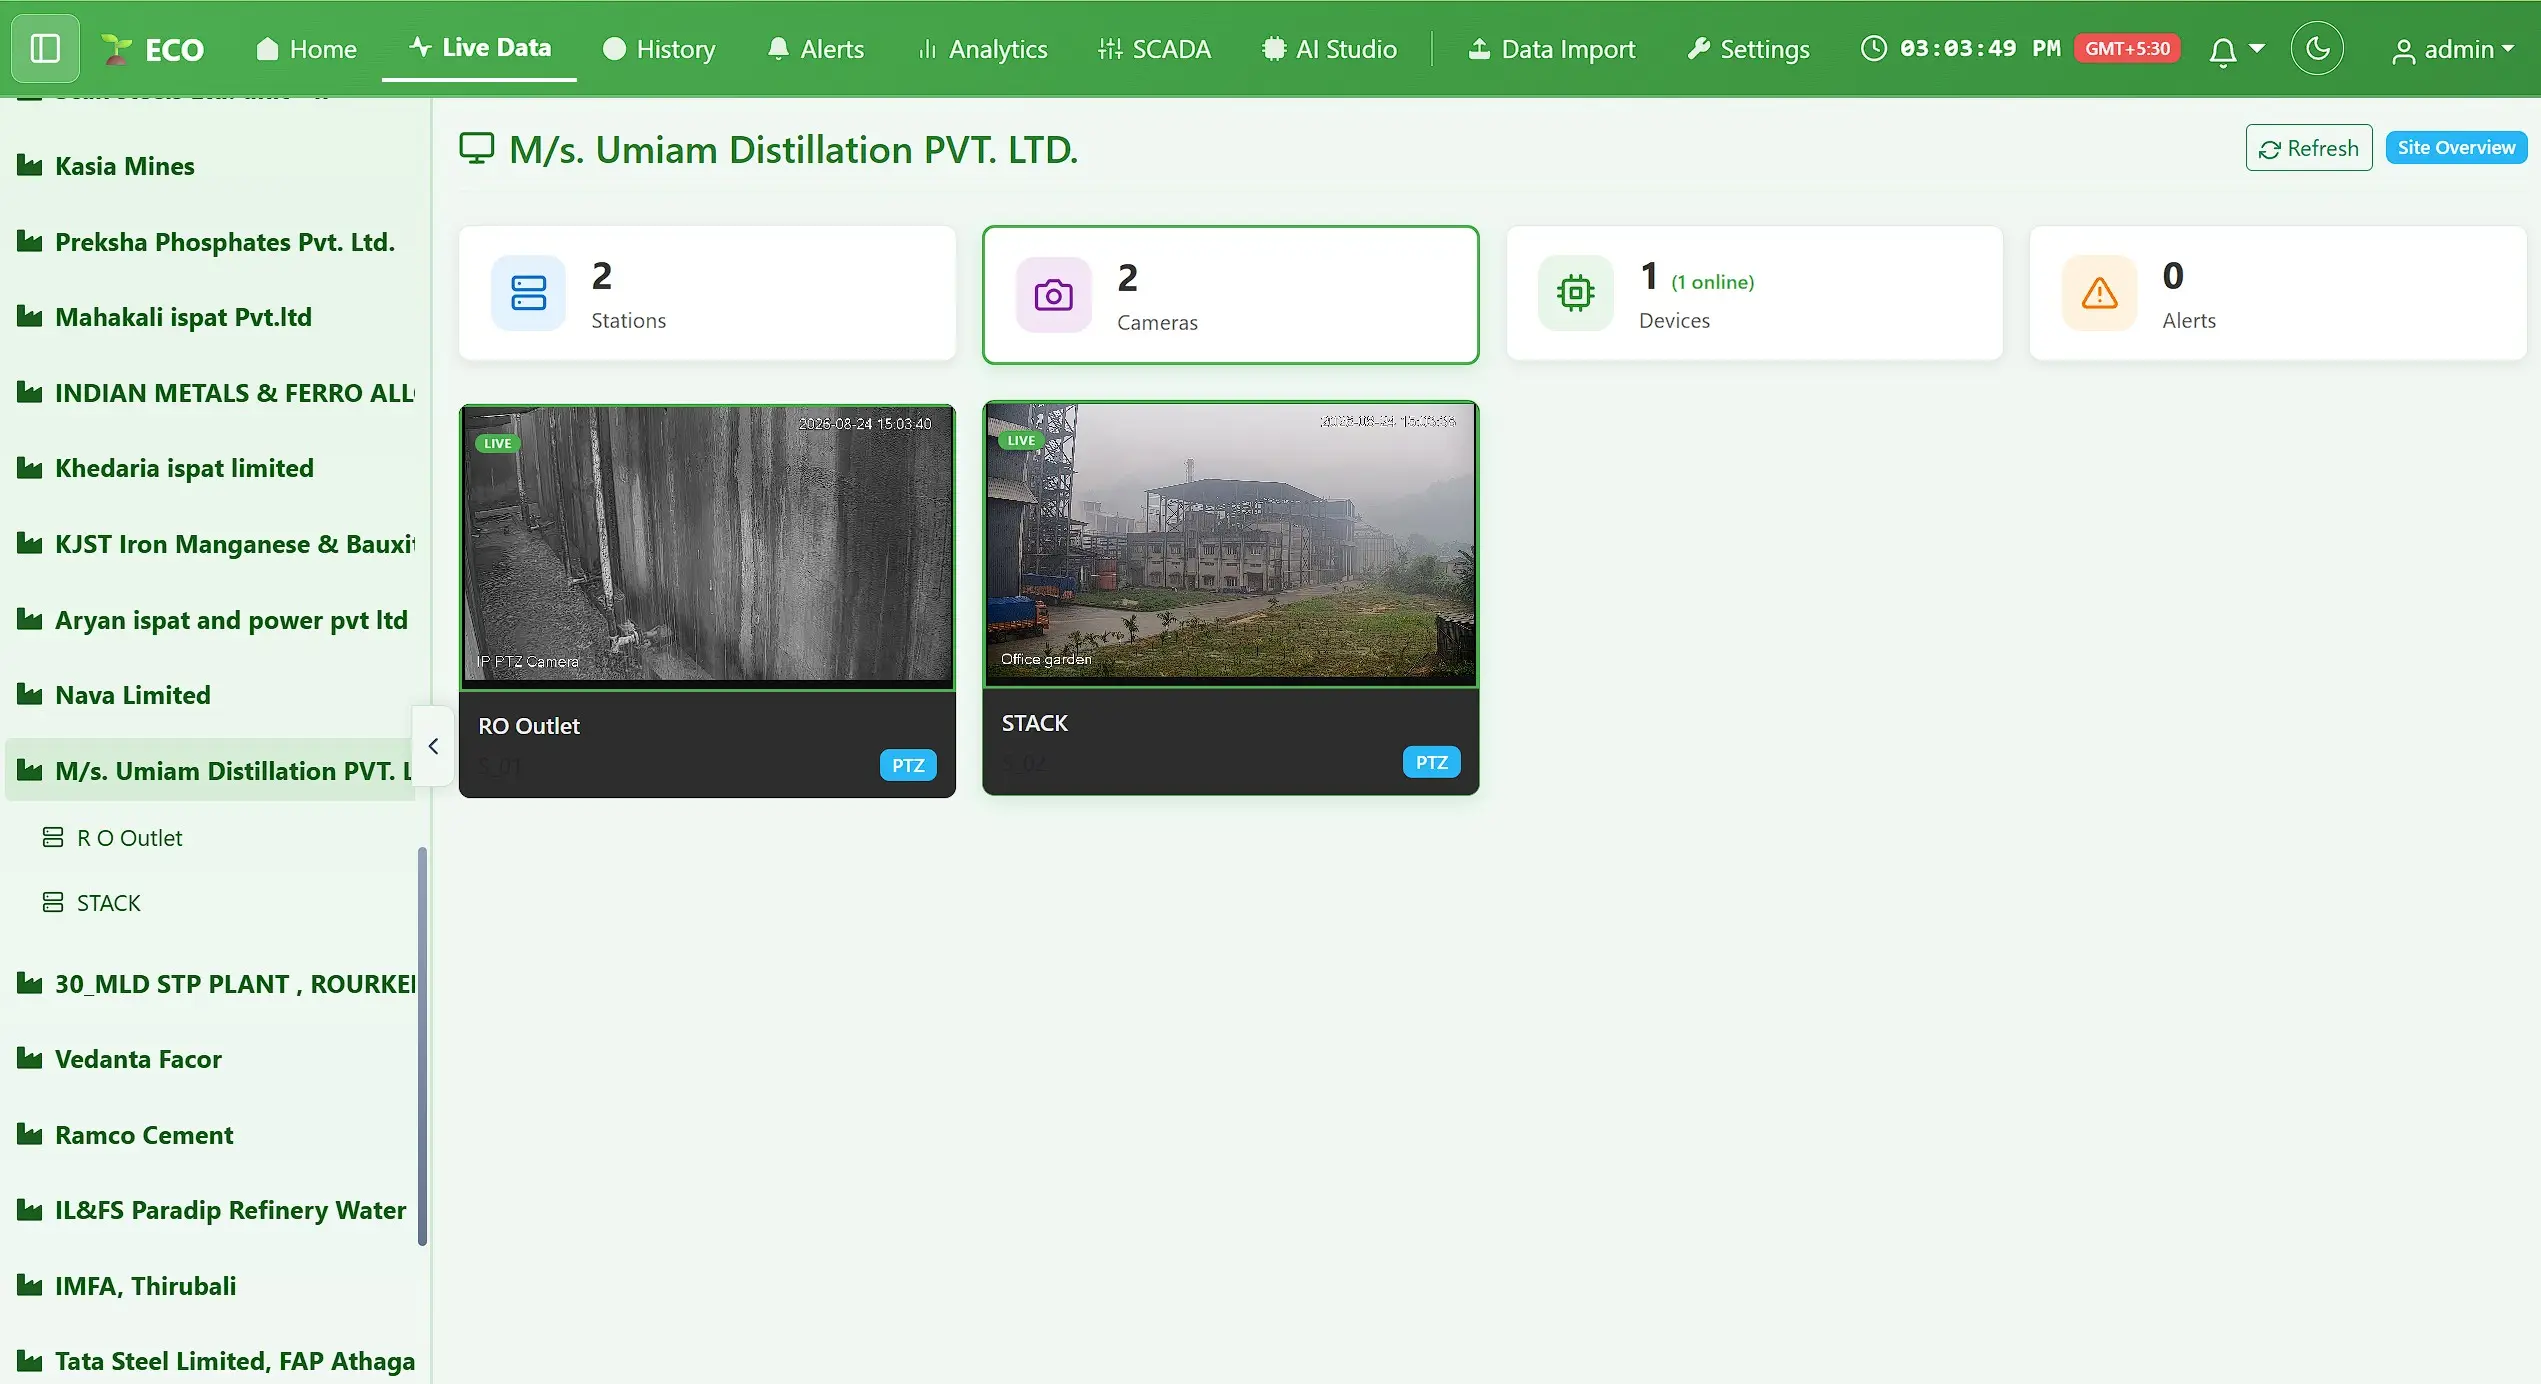
Live streaming with PTZ control, history playback and remote monitoring, in the same portal as the data — so a strange number and the thing producing it are one click apart.
Every module in the portal.
One navigation bar across the top; each entry is a full workspace.
Home
Your account at a glance — stations, cameras, devices online and open alerts.
Live Data
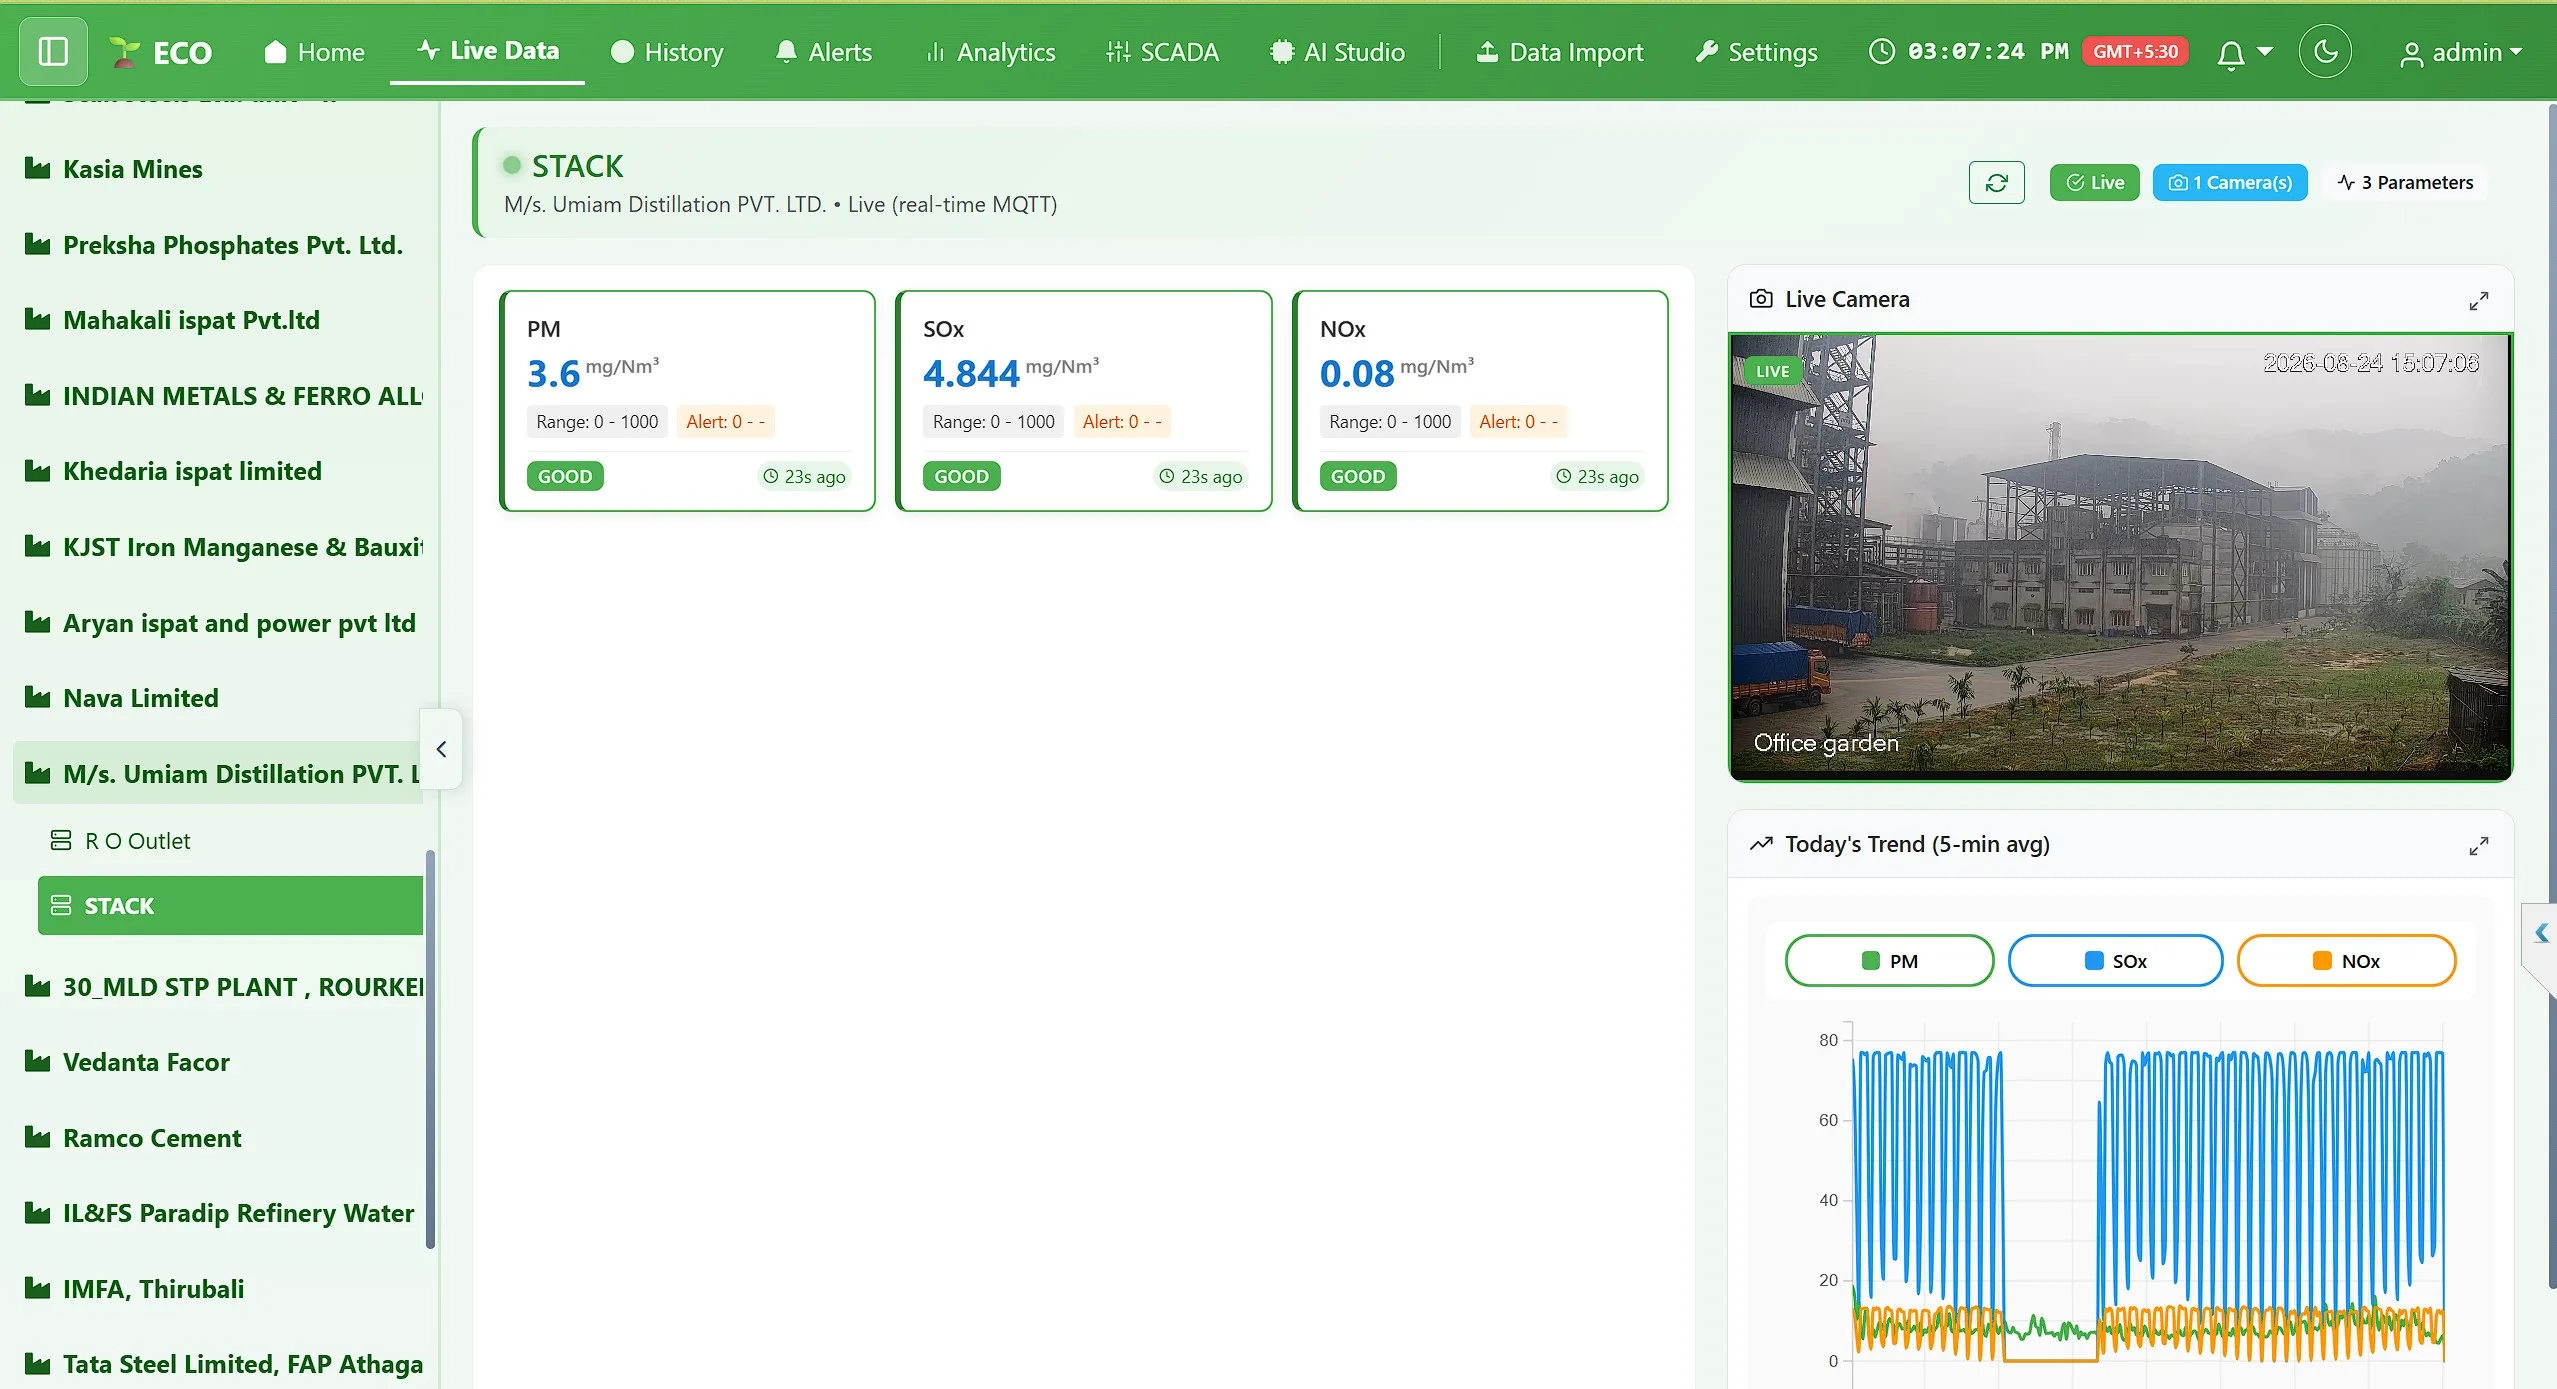
Real-time MQTT readings per station, with range, alert band, status and age on every card.
History
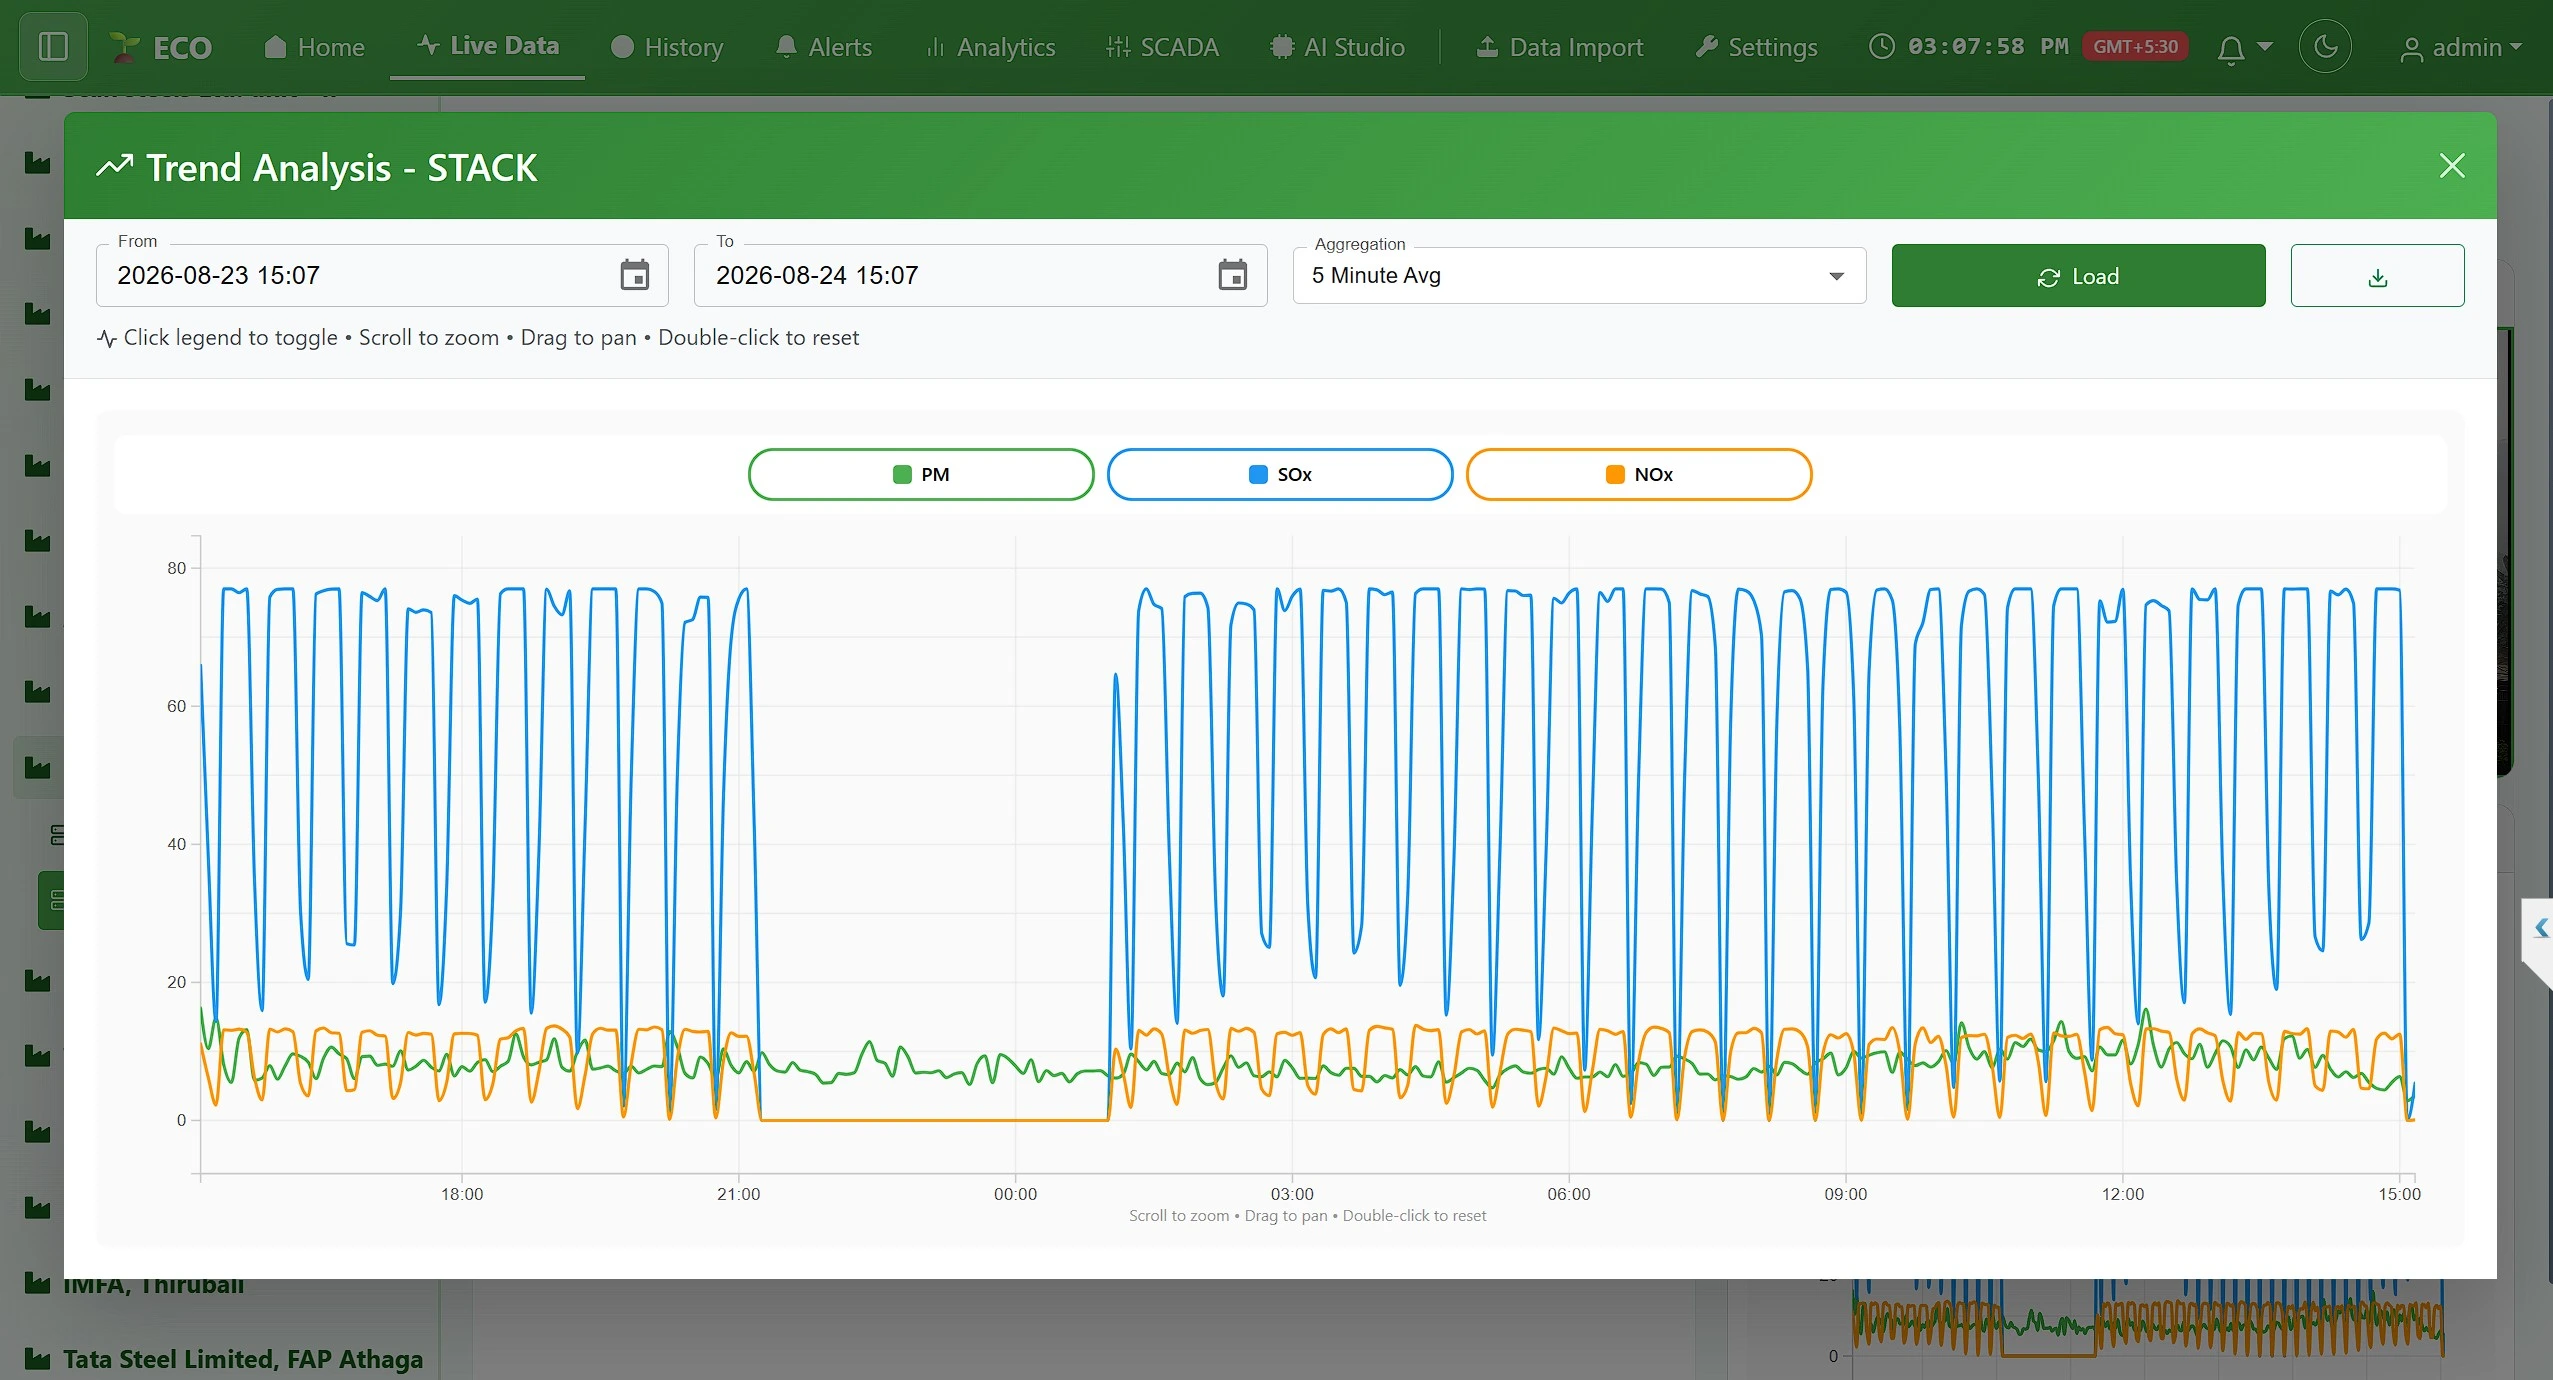
Any window, any aggregation. Zoom, pan, toggle parameters and download what you see.
Alerts
Filter by industry, status, severity, type and date. Acknowledge one or all active at once.
Analytics
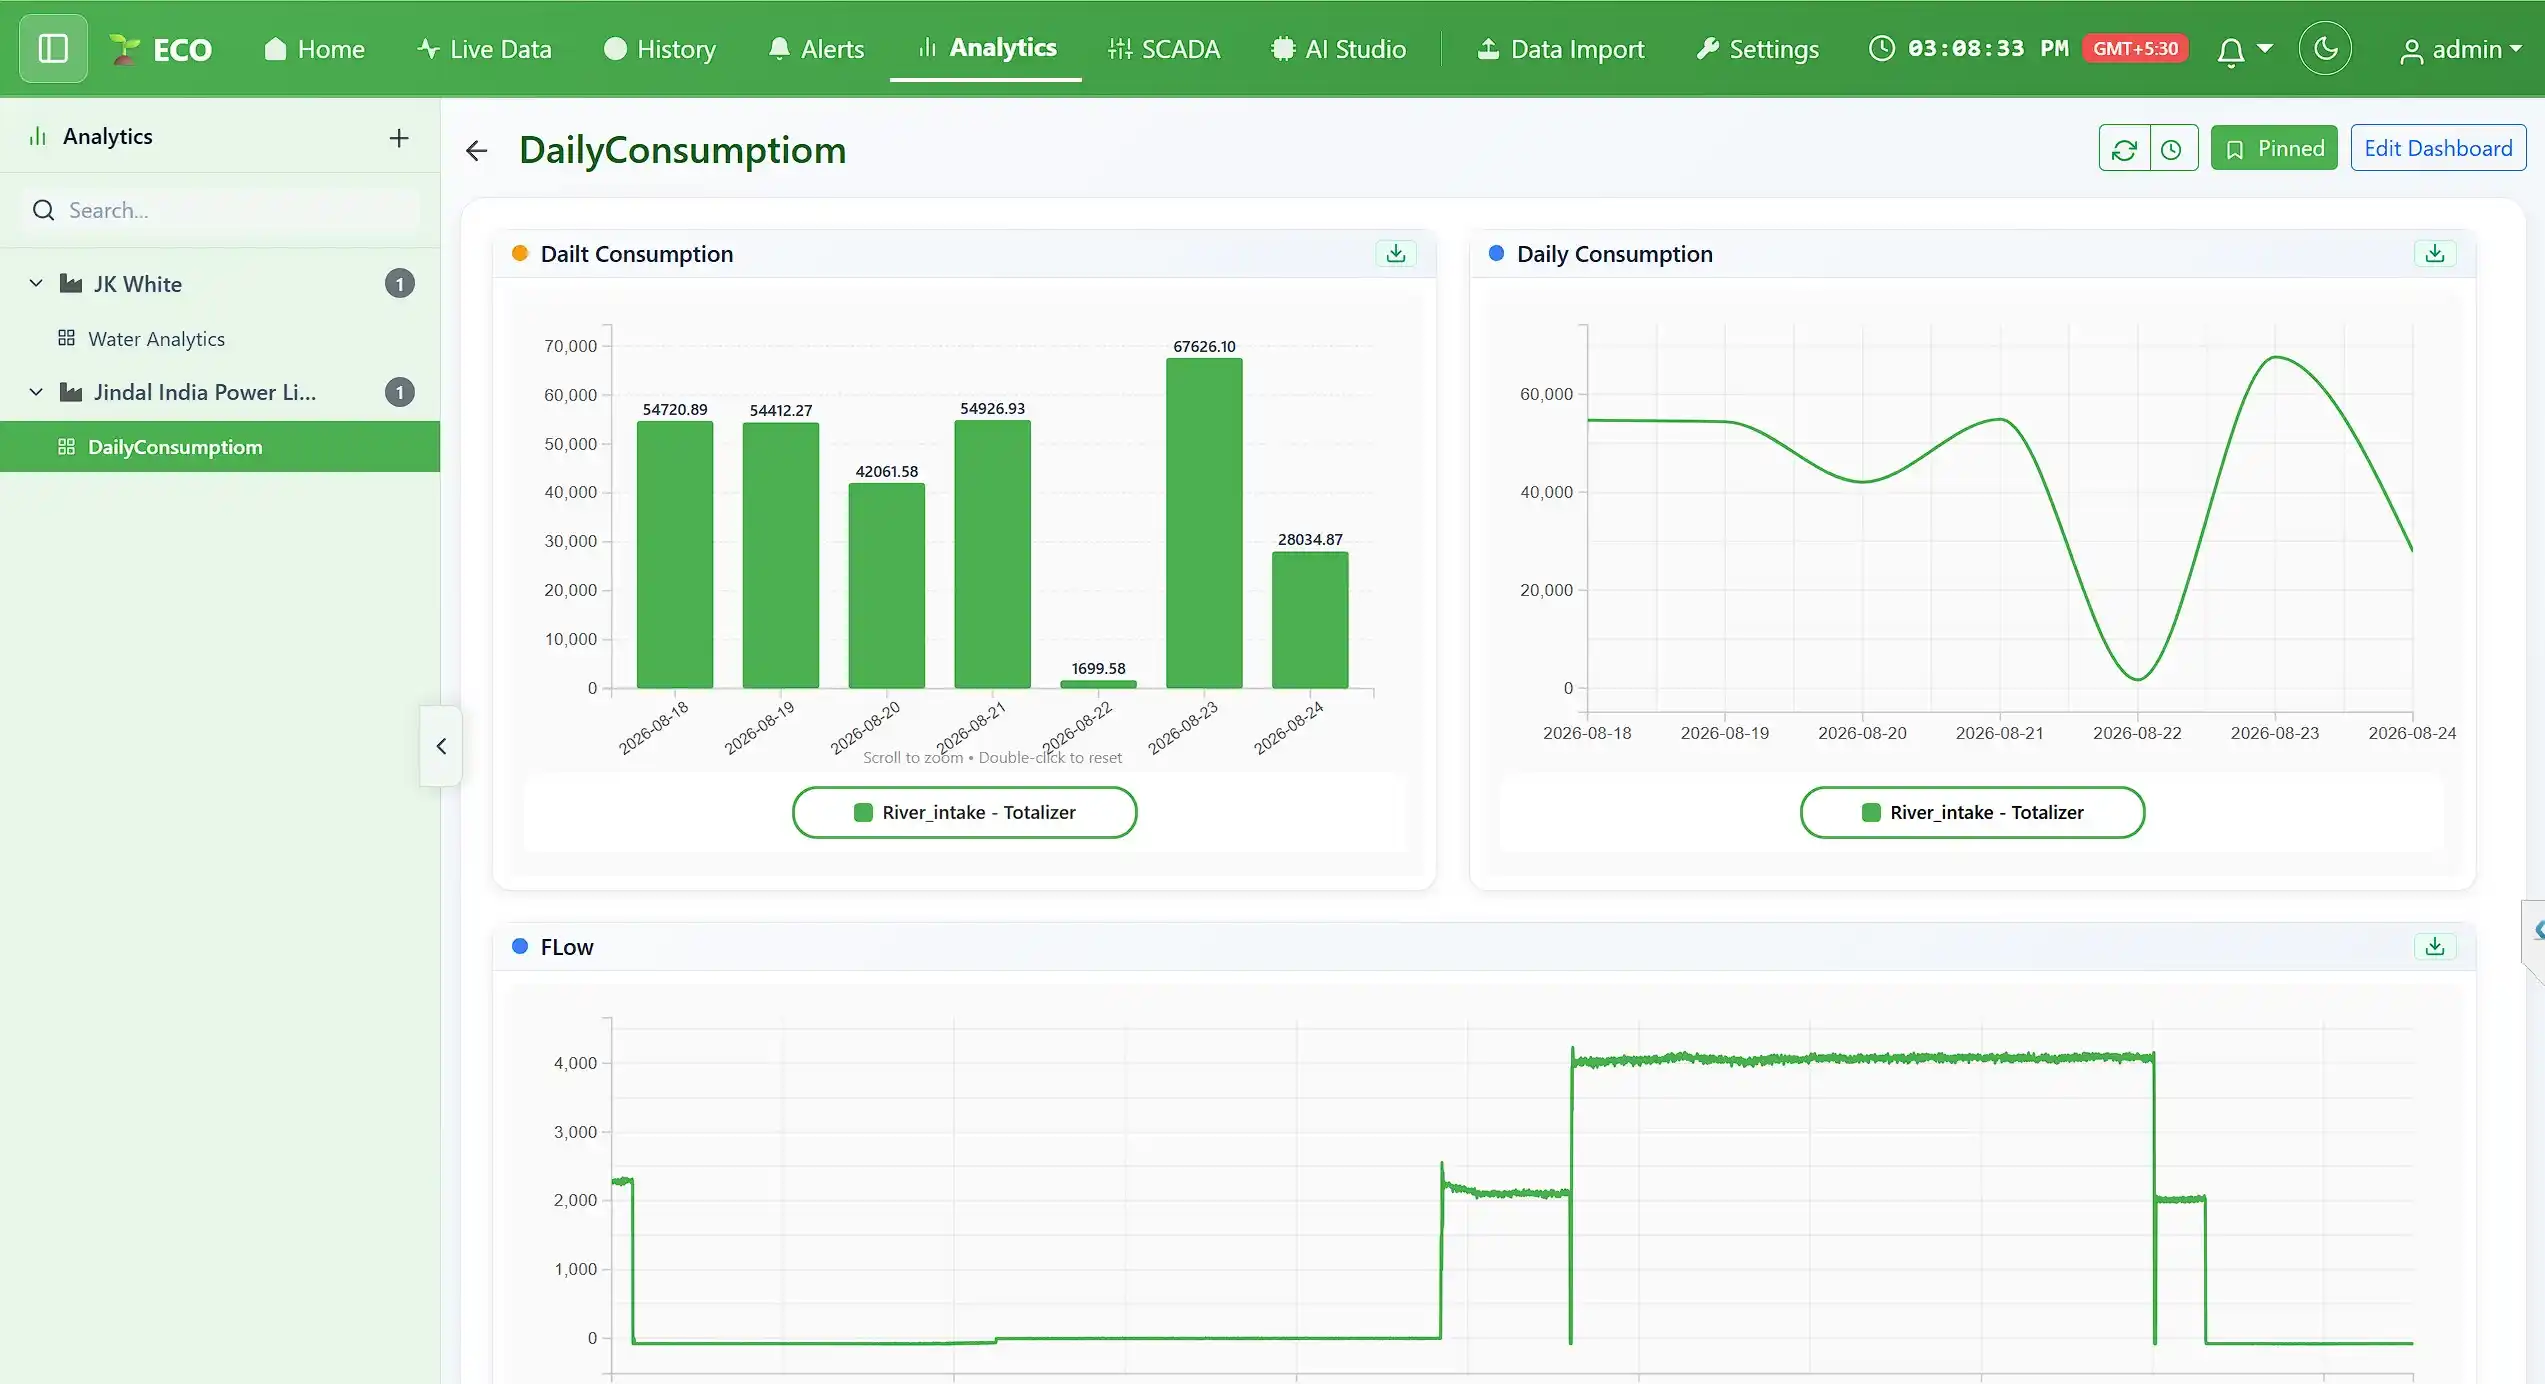
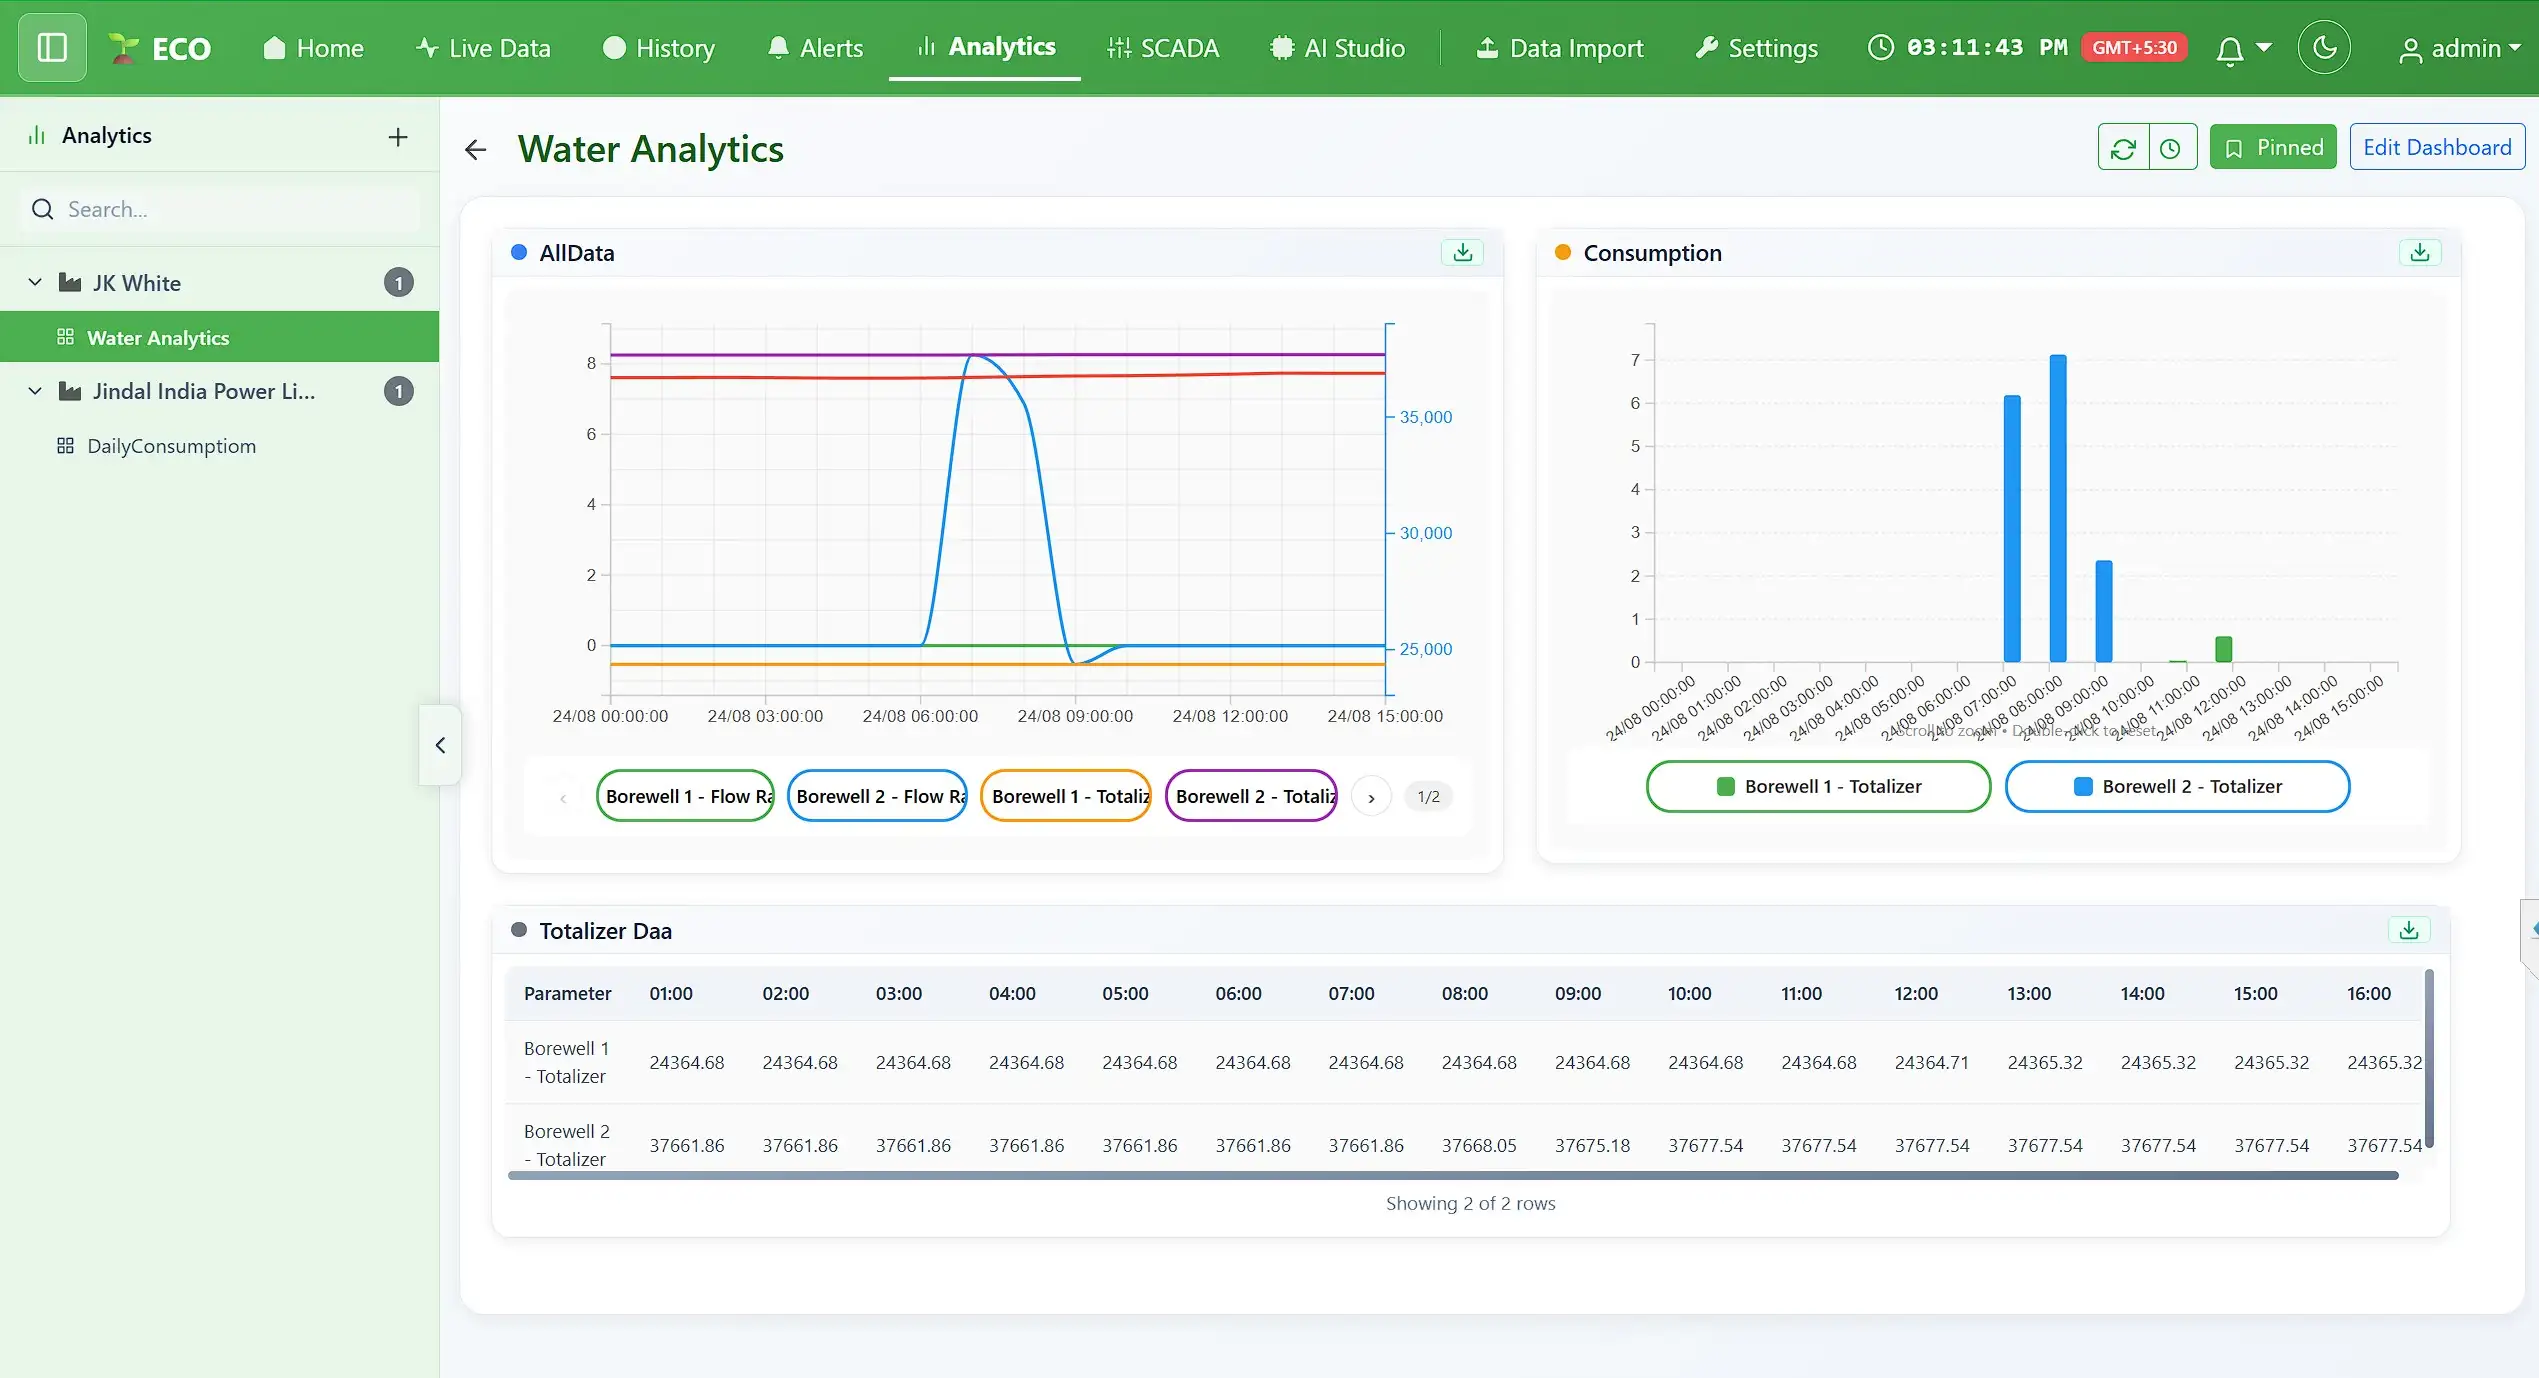
Saved dashboards per industry — bar, line, flow and totalizer widgets, pinned and editable.
SCADA
Plant views for operators, driven by the same tags as the rest of the portal.
AI Studio
Train a model on a parameter and let it raise anomaly alerts when a reading leaves the expected band.
Data Import
Bring in historic or third-party records so the trend does not start the day you installed us.
Settings
Industries, stations, parameters, cameras, users and thresholds — all configured in-portal.
A reading with its context attached.
Every parameter card carries its value and unit, the instrument range, the alert band, a status and how long ago it arrived — so nobody has to remember what normal looks like.
Advanced charts and widgets, to plot the analytics you need.
Multi-layer aggregation: raw samples rolled into minute, hourly, daily and custom windows, layered on one chart with dual axes, mixed series types and per-widget export.
Getting a device onto Eco.
Three steps, usually done before the electrician has packed up.
Wire and power
Land the sensors on the terminals, give it 24 V, clip it to the rail.
Register the ID
Every unit carries a device ID on its face. Add it to your account and name the site.
Build the view
Drop widgets onto a dashboard, set your limits, and hand the link to whoever needs it.
See it with your own data.
Send us a tag list and we will set up a demo dashboard on Eco before we talk.